BOOKS FOR YOU TO READ AND DOWNLOAD
- English in India: Loyalty and Attitudes by
Annika Hohenthal - Language In Science by
M. S. Thirumalai, Ph.D. - Vocabulary Education by
B. Mallikarjun, Ph.D. - A CONTRASTIVE ANALYSIS OF HINDI AND MALAYALAM by V. Geethakumary, Ph.D.
- LANGUAGE OF ADVERTISEMENTS IN TAMIL by Sandhya Nayak, Ph.D.
- An Introduction to TESOL: Methods of Teaching English to Speakers of Other Languages by M. S. Thirumalai, Ph.D.
- Transformation of Natural Language into Indexing Language: Kannada - A Case Study by B. A. Sharada, Ph.D.
- How to Learn Another Language? by M.S.Thirumalai, Ph.D.
- Verbal Communication with CP Children by Shyamala Chengappa, Ph.D. and M.S.Thirumalai, Ph.D.
- Bringing Order to Linguistic Diversity - Language Planning in the British Raj by
Ranjit Singh Rangila,
M. S. Thirumalai,
and B. Mallikarjun
REFERENCE MATERIAL
- Lord Macaulay and His Minute on Indian Education
- Languages of India, Census of India 1991
- The Constitution of India: Provisions Relating to Languages
- The Official Languages Act, 1963 (As Amended 1967)
- Mother Tongues of India, According to 1961 Census of India
BACK ISSUES
- FROM MARCH 2001
- FROM JANUARY 2002
- INDEX OF ARTICLES FROM MARCH, 2001 - MAY 2003
- INDEX OF AUTHORS AND THEIR ARTICLES FROM MARCH, 2001 - MAY 2003
- E-mail your articles and book-length reports to thirumalai@bethfel.org or send your floppy disk (preferably in Microsoft Word) by regular mail to:
M. S. Thirumalai
6820 Auto Club Road #320
Bloomington, MN 55438 USA. - Contributors from South Asia may send their articles to
B. Mallikarjun,
Central Institute of Indian Languages,
Manasagangotri,
Mysore 570006, India or e-mail to mallikarjun@ciil.stpmy.soft.net - Your articles and booklength reports should be written following the MLA, LSA, or IJDL Stylesheet.
- The Editorial Board has the right to accept, reject, or suggest modifications to the articles submitted for publication, and to make suitable stylistic adjustments. High quality, academic integrity, ethics and morals are expected from the authors and discussants.
Copyright © 2001
M. S. Thirumalai
URDU IN RAJASTHAN
A. R. Fatihi, Ph.D.
Area 3,42,239 sq. km. Population 440.0 lakhs Capital Jaipur Principal Languages Hindi and Rajasthani
1. A HISTORICAL, GEOGRAPHICAL, AND LINGUISTIC SKETCH OF RAJASTHAN
The entire western flank of the state borders with Pakistan, while Punjab, Haryana, Uttar Pradesh and Madhya Pradesh bind Rajasthan in the north, north-east and south-east, and Gujarat in the south-west. Area-wise, Rajasthan is the second largest State in India. Prior to Independence, the state was known as Rajputan, or the home of Rajputs - a martial community that ruled over this area for centuries. The process of uniting the scattered princely states began in 1948, and in 1956 the States Reorganisation Act was promulgated. First came Matsya Union (1948) consisting of a few princely states. Slowly and gradually other states merged with this union.
Rajasthan has a population of 4,40,05,990 persons. Hindi is the regional language of the State, which is spoken by 87.66 per cent of the population.
The major linguistic minority groups in the State include the speakers of Bhili/Bhilodi (3.96%), Urdu (2.23%), and Panjabi (4.78%).
The minority language speakers who constitute less than 1 per cent are the speakers of Gujarati (0.15%) and Sindhi (0.89%).
The speakers of minority languages who constitute less than 0.09 per cent are the speakers of Bengali (0.05%), Malayalam (0.05%), Marathi (0.05%), Oriya (0.02%), Tamil (0.02%), Gorkhali/Nepali (0.01%), Lahnda (0.01%), and Telugu (0.02%).
The names of the DistrictS along with the actual percentage of population, district headquarters, and the total Urdu population are given below in Table 1.
Table 1: Area, Population and Headquarters of Districts
District
Area (sq km)
Population
Headquarters
Total Urdu Population (Lacs)
%age
(Between 3 & 5)
Muslim Population (Lacs)
%age
(Between 3 & 6)
%age
(Between 5 & 6)
1
2
3
4
5
6
Ajmer
8481
17.3
Ajmer
0.43
2.5
1.7
9.9
25.3
Alwar
8380
23.0
Alwar
0.06
0.3
2.6
11.1
2.3
Banswara
5037
11.6
Banswara
0.11
1.0
0.4
3.1
27.5
Barmer
28387
14.4
Barmer
0.02
0.1
0.2
1.1
10.0
Bharatpur
5066
16.6
Bharatpur
0.05
0.3
1.8
11.0
2.8
Bhilwara
10455
15.9
Bhilwara
0.28
1.8
0.8
5.3
35.0
Bikaner
27244
12.1
Bikaner
0.19
1.6
1.3
10.5
14.6
Bundi
5550
7.7
Bundi
0.13
1.6
0.4
5.7
32.5
Chittaurgarh
10856
14.8
Chittaurgarh
0.21
1.4
0.8
5.2
26.3
Churu
16830
15.4
Churu
0.36
2.3
1.6
10.6
22.5
Dhaulpur
3034
7.5
Dhaulpur
0.07
1.0
0.5
6.1
14.0
Dungarpur
3770
8.7
Dungarpur
0.05
0.6
0.2
2.8
25.0
Ganganagar
7944
26.2
Ganganagar
0.07
0.3
1.0
3.9
7.0
Jaisalmer
38401
3.4
Jaisalmer
2.24
65.0
3.8
110.7
58.9
Jalor
10640
11.4
Jalor
0.01
0.1
0.8
7.3
1.3
Jaipur
11588
47.2
Jaipur
0.01
0.0
0.4
0.9
2.5
Jhalawar
6219
9.5
Jhalawar
0.17
1.8
0.6
6.7
28.3
Jhunjhunun
5928
15.8
Jhunjhunun
0.36
2.3
1.5
9.6
24.0
Jodhpur
22850
21.5
Jodhpur
0.56
2.6
2.2
10.4
25.5
Kota
5481
20.3
Kota
0.84
4.1
1.9
9.4
44.2
Nagaur
17718
21.4
Nagaur
1.13
5.2
2.6
12.1
43.5
Pali
12387
14.9
Pali
0.12
0.8
0.9
5.8
13.3
Sawai Madhopur
5043
19.6
Sawai Madhopur
0.51
2.6
1.5
7.4
34.0
Sikar
7732
18.4
Sikar
0.61
3.3
2.1
11.4
29.0
Sirohi
5136
6.5
Sirohi
0.02
0.3
0.2
2.9
10.0
Tonk
7194
9.8
Tonk
0.59
6.0
1.0
10.0
59.0
Udaipur
12511
28.9
Udaipur
0.33
1.2
0.9
3.2
36.7
Total
440.0
9.53
2.2
33.8
7.7
28.2
2. URDU IN RAJASTHAN
Hindi is the official language of the State. The Government has issued orders to publish important rules, regulations, notices, etc., in the minority languages in the areas where their speakers constitute 15 per cent or more of the local population.
The State Language Department translates important rules and regulations into minority languages.
A detailed district wise break-up of the total Urdu population in Rajasthan is shown in Table 2.
Hindi is the official language of the State. The Government has issued orders to publish important rules, regulations, notices, etc., in the minority languages in the areas where their speakers constitute 15 per cent or more of the local population.
The State Language Department translates important rules and regulations into minority languages.
A detailed district-wise break-up of the total Urdu population in Rajasthan is shown in Table 2.
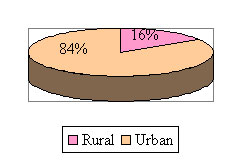
In the light of the figures given above, we may draw the conclusion that Urdu is basically an urban-based language in Rajasthan. The Urban/Rural division of Urdu population is presented diagrammatically below. The graph presented below exhibits the rural urban division of Urdu population in Rajasthan.
S.No.
District
Total Population (Lacs)
Total Urdu Population (Lacs)
Total Male (Lacs)
Total Female (Lacs)
Rural (Lacs)
Urban (Lacs)
1.
Ajmer
17.3
0.43
0.23
0.21
0.09
0.34
2.
Alwar
23.0
0.06
0.03
0.03
0.05
0.007
3.
Banswara
11.6
0.11
0.06
0.05
0.02
0.09
4.
Barmer
14.4
0.02
0.01
0.01
0.01
0.008
5.
Bharatpur
16.6
0.05
0.03
0.02
0.04
0.004
6.
Bhilwara
15.9
0.28
0.14
0.14
0.05
0.23
7.
Bikaner
12.1
0.19
0.10
0.09
0.02
0.17
8.
Bundi
7.7
0.13
0.07
0.06
0.02
0.10
9.
Chittaurgarh
14.8
0.21
0.11
0.10
0.06
0.15
10.
Churu
15.4
0.36
0.18
0.18
0.02
0.34
11.
Dholpur
7.5
0.07
0.04
0.03
0.01
0.06
12.
Dungarpur
8.7
0.05
0.02
0.02
0.003
0.05
13.
Ganganagar
26.2
0.07
0.04
0.03
0.06
0.01
14.
Jaipur
3.4
2.24
1.16
1.08
0.05
2.19
15.
Jaisalmer
11.4
0.01
0.004
0.003
0.01
0.002
16.
Jalor
47.2
0.01
0.003
0.003
0.00
0.005
17.
Jhalawar
9.5
0.17
0.09
0.08
0.03
0.14
18.
Jhunjhunun
15.8
0.36
0.18
0.18
0.08
0.29
19.
Jodhpur
21.5
0.56
0.30
0.27
0.05
0.52
20.
Kota
20.3
0.84
0.44
0.40
0.08
0.76
21.
Nagaur
21.4
1.13
0.57
0.55
0.34
0.78
22.
Pali
14.9
0.12
0.06
0.06
0.01
0.11
23.
Sawai Madhopur
19.6
0.51
0.27
0.24
0.25
0.26
24.
Sikar
18.4
0.61
0.31
0.30
0.04
0.57
25.
Sirohi
6.5
0.02
0.01
0.01
0.00
0.02
26.
Tonk
9.8
0.59
0.30
0.29
0.06
0.52
27.
Udaipur
28.9
0.33
0.17
0.16
0.03
0.30
Total
440.0
9.53
4.92
4.61
1.51
8.02
Chart 1: Rural and Urban Division of Urdu Population
The numerical strength of Urdu speakers shows an uneven distribution over different districts in Rajasthan. The difference in numerical strength of Urdu speakers varies from a few hundred to thousands.
3. TOP TEN DISTRICTS OF URDU POPULATION IN RAJASTHAN
On the basis of the variation in the numerical strength of the Urdu speakers, top ten districts have been identified and presented below in Table 3.
S. No.
Districts
Total Population (Lacs)
Total Urdu Population (Lacs)
%age (Lacs)
1.
Ajmer
17.3
0.43
2.49
2.
Churu
15.4
0.36
2.34
3.
Jaipur
3.4
2.24
4.75
4.
Jhunjhunun
15.8
0.36
2.31
5.
Jodhpur
21.5
0.56
2.62
6.
Kota
20.3
0.84
4.14
7.
Nagaur
21.4
1.13
5.25
8.
Sawai Madhopur
19.6
0.51
2.58
9.
Sikar
18.4
0.61
3.32
10.
Tonk
9.8
0.59
6.05
On the basis of the figures presented in the table above the following observations can be made.
- All the districts have a concentration of Urdu speakers of below 10% of the total population.
- District Ajmer has below 1 lac of Urdu speakers, which is 2.49% of the total population.
- Churu and Jhunjhunun occupies Ninth and Tenth position with 2.34 & 2.31%
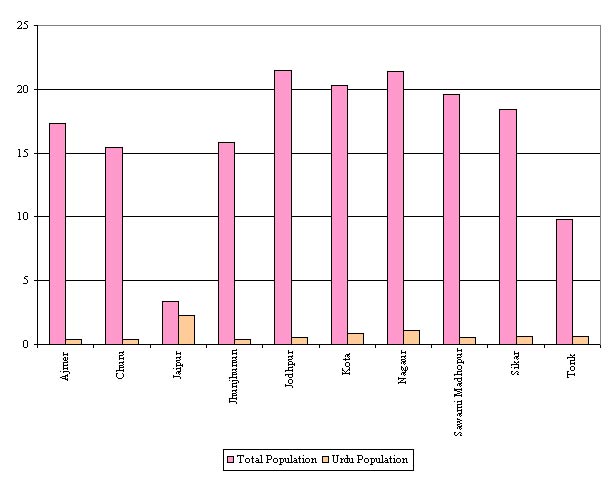
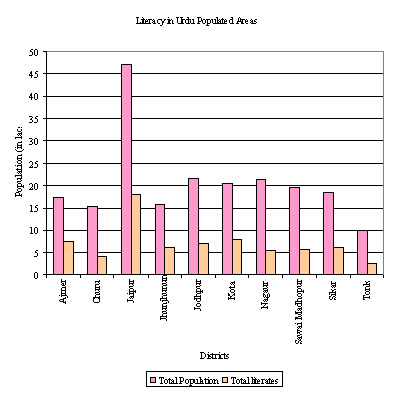
The graph given below presents the gap between Urdu population and Total population in the top ten districts of Urdu population in Rajasthan. As shown in the graph, the difference between the Urdu population and total population is Ajmer in Guntur and minimum in Jaipur.
Chart 2: Total Population and Total Urdu Population in Urdu Populated Areas
4. URDU AS AN ICON OF MUSLIM IDENTIFICATION
To assess the validity of the claim "Urdu as an icon of Muslim identification", the section below provides a distribution of Muslim and Urdu populations in Rajasthan. The table given below provides a district-wise distribution of Muslim and Urdu population.
S. No.
Districts
Total Muslim Population (Lacs)
Total Urdu Population (Lacs)
%age
1.
Ajmer
1.7
0.43
25.24
2.
Alwar
2.6
0.06
2.42
3.
Banswara
0.4
0.11
31.38
4.
Barmer
0.2
0.02
11.61
5.
Bharatpur
1.8
0.05
2.68
6.
Bhilwara
0.8
0.28
33.50
7.
Bikaner
1.3
0.19
14.88
8.
Bundi
0.4
0.13
28.83
9.
Chittaurgarh
0.8
0.21
26.72
10.
Churu
1.6
0.36
22.07
11.
Dholpur
0.5
0.07
15.63
12.
Dungarpur
0.2
0.05
19.80
13.
Ganganagar
1.0
0.07
7.25
14.
Jaipur
3.8
2.24
58.79
15.
Jaisalmer
0.8
0.01
0.86
16.
Jalor
0.4
0.01
1.51
17.
Jhalawar
0.6
0.17
27.38
18.
Jhunjhunun
1.5
0.36
23.89
19.
Jodhpur
2.2
0.56
25.09
20.
Kota
1.9
0.84
43.90
21.
Nagaur
2.6
1.13
43.33
22.
Pali
0.9
0.12
13.56
23.
Sawai Madhopur
1.5
0.51
34.79
24.
Sikar
2.1
0.61
29.16
25.
Sirohi
0.2
0.02
11.43
26.
Tonk
1.0
0.59
60.36
27.
Udaipur
0.9
0.33
35.85
5. DECENNIAL GROWTH OF MUSLIMS AND URDU SPEAKERS
Identification with a particular Linguistic Identity is very much a matter of social awareness on the part of an individual. Change in Linguistic Identity does not signify change in linguistic behaviour. Oscillation in mother-tongue declaration reveals a shift in social identification under changed circumstances. The table given below presents the decennial growth of Muslims and Urdu speakers reported in 1971, 1981 and 1991 census reports.
S.No.
State
1971
%age
1981
%age
1991
1.
Muslims
1778275
28.64
2492145
29.31
3525339
2.
Urdu
650947
10.26
725402
23.75
951304
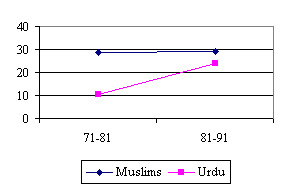
This table indicates a considerable rise ranging between 10 to 23 per cent among Urdu speakers in the state during 1971 to 1981, and 1981 to 1991. In other words, Urdu Population rises from 10% in 71-81 to 23% in 81-91.
The decennial growth of Muslims in Rajasthan shows a slightly slower increase ranging between 28 to 29 per cent during 1971 to 1981, and 1981 to 1991. The graph given below displays a steep rise in case of Urdu. However the figures of Muslim decennial growth have shown a slower but steady increase.
Chart 3: Decennial Growth in Muslim and Urdu
6. BILINGUALISM AMONG URDU SPEAKERS
The Urdu population is mostly scattered throughout the country. So, a large proportion of Urdu speakers in many regions tends to have bilingual control over the respective dominant language of the region along with Urdu. The table below presents the figures of bilingualism among Urdu speakers.
Table 6: Bilingualism among Urdu Population
Total
%age
Male
%age
Female
%age
Rural
Urban
Total No. of Urdu speakers
9.5
(2.1) 2.1
4.9
51.6
4.6
48.3
1.5 (15.8%)
8.0 (84.1%)
Monolinguals
5.3
55.8
2.5
46.2
2.9
53.7
Bilinguals
4.2
44.1
2.5
58.4
1.8
41.5
S. No.
Languages
Speakers
%age to col. 2
Male
%age to col. 4
Female
%age to col. 6
Rural
%age to col. 8
1.
Arabic
0.2
2.4
0.1
41.5
1.3
58.4
2.
English
0.1
1.5
0.1
68.1
4.6
31.8
3.
Hindi
3.8
40.1
2.3
59.1
1.6
40.8
The figures given in the table indicate that bilingualism among Urdu speakers is much higher than the State average. 44.1% of the total Urdu population is bilingual; Hindi is the most preferred language among the Urdu speakers of Rajasthan. 40% of the total Urdu population has bilingualism in Hindi.
7. LITERACY IN URDU POPULATED AREAS
Despite the progress of literacy programmes in India, there are more illiterate adults in India today than there were in 1951. However, we may not ignore the fact that the literacy rates in the country have shown a steady increase of about eight per cent every decade since 1951, from a national average of 19.74% in 1951.
The literacy level is linked with the urban/rural factor in a significant way. The chunk of illiterates lives in the rural areas. They have no access to information through the written word.
According to the 1991 census, 74.30 per cent of the total Indian population lives in the rural areas and 25.7 per cent in urban areas. On the other hand, the literacy rate in urban areas is 61.72 while in the rural areas it is only 36.31 per cent.
The male/female parameter is also very significant in literacy. Males show higher literacy rate than females.
The table given below presents the figures of literacy among Urdu population.
Table 7: Literacy
S. No.
Districts
Total Population
Total Literates
Male
Female
Rural
Urban
1.
Ajmer
17.3 Lacs
7.4 Lacs (42.6%)
5.0 Lacs (68.4%)
2.3 Lacs (31.5%)
2.9 Lacs (39.1%)
4.5 Lacs (60.8%)
2.
Churu
15.4 Lacs
4.2 Lacs (27.3%)
3.2 Lacs (75.7%)
1.0 Lacs (24.2%)
2.3 Lacs (54.7%)
1.9 Lacs (45.2%)
3.
Jaipur
47.2 Lacs
18.1 Lacs (38.2)
13.0 Lacs (71.9%)
5.1 Lacs (28.1%)
7.7 Lacs (42.6%)
1.0 Lacs (5.7%)
4.
Jhunjhunun
15.8 Lacs
6.0 Lacs (37.7%)
4.4 Lacs (74.0%)
1.6 Lacs (25.9%)
4.4 Lacs (74.2%)
1.5 Lacs (25.7%)
5.
Jodhpur
21.5 Lacs
7.0 Lacs (32.6%)
5.2 Lacs (73.9%)
1.8 Lacs (26.0%)
2.9 Lacs (40.6%)
4.2 Lacs (59.3%)
6.
Kota
20.3 Lacs
7.8 Lacs (38.2%)
5.5 Lacs (71.1%)
2.2 Lacs (28.8%)
3.6 Lacs (45.9%)
4.2 Lacs (54.0%)
7.
Nagaur
21.4 Lacs
5.4 Lacs (25.2%)
4.3 Lacs (79.6%)
1.1 Lacs (20.3%)
4.0 Lacs (74.3%)
1.4 Lacs (25.6%)
8.
Sawai Madhopur
19.6 Lacs
5.6 Lacs (28.6%)
4.6 Lacs (81.4%)
1.0 Lacs (18.5%)
4.2 Lacs (74.9%)
1.4 Lacs (25.0%)
9.
Sikar
18.4 Lacs
6.1 Lacs (33.1%)
4.7 Lacs (77.1%)
1.4 Lacs (22.8%)
4.4 Lacs (72.4%)
1.7 Lacs (27.5%)
10.
Tonk
9.8 Lacs
2.6 Lacs (27.0%)
2.1 Lacs (78.2%)
0.6 Lacs (21.7%)
1.8 Lacs (67.6%)
0.9 Lacs (32.3%)
Chart 4: Literacy
The graph presented above indicates that the rural districts of Rajasthan show a higher degree of illiteracy in comparison with the urban district of Jaipur.
8. LEVELS OF EDUCATION AMONG URDU POPULATION
In late nineties, India adopted a series of policies and programmes to improve its education system. These included the approval and adoption of the policy called EDUCATION FOR ALL. Most of these policies aimed at improving Primary Education, especially in rural areas.
In response to wide-spread concerns over the deteriorating standards of education on the one hand and the importance of education as an instrument for national and global development, the need to strengthen the educational system was recognized by the Ministry of Human Resource Development. The maladies of the Indian education system are clearly alarming.
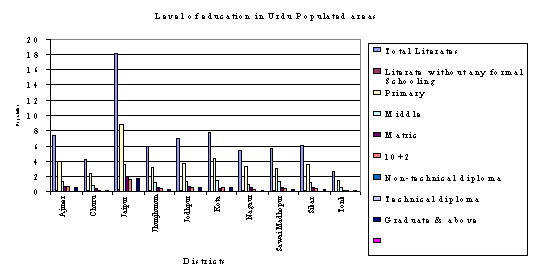
The table given below presents the level of education in Urdu populated areas of the state.Table 8: Level of Education among Urdu Population
Districts.
Total Literates
Literate without any formal Schooling
Primary
Middle
Matric
10+2
Non-technical diploma
Technical diploma
Graduate & above
Ajmer
7.4 Lacs
0.11 Lacs (1.4%)
4.0 Lacs (53.7%)
1.3 Lacs (17.3%)
0.7 Lacs (9.6%)
0.7 Lacs (9.2%)
0.009 Lacs (0.1%)
0.020 Lacs (0.2%)
0.6 Lacs (8.1%)
Churu
4.2 Lacs
0.15 Lacs (3.5%)
2.4 Lacs (58.3%)
0.8 Lacs (19.6%)
0.4 Lacs (9.0%)
0.2 Lacs (5.0%)
0.003 Lacs (0.08%)
0.005 Lacs (0.1%)
0.2 Lacs (4.4%)
Jaipur
18.1 Lacs
0.28 Lacs (1.5%)
8.8 Lacs (48.5%)
3.5 Lacs (19.2%)
2.0 Lacs (11.1%)
1.6 Lacs (9.0%)
0.013 Lacs (0.07%)
0.038 Lacs (0.2%)
1.8 Lacs (10.1%)
Jhunjhunun
6.0 Lacs
0.23 Lacs (3.8%)
3.2 Lacs (54.0%)
1.2 Lacs (20.6%)
0.6 Lacs (9.6%)
0.4 Lacs (6.2%)
0.009 Lacs (0.1%)
0.013 Lacs (0.2%)
0.3 Lacs (5.0%)
Jodhpur
7.0 Lacs
0.09 Lacs (1.2%)
3.7 Lacs (53.3%)
1.3 Lacs (18.7%)
0.7 Lacs (10.6%)
0.5 Lacs (7.6%)
0.007 Lacs (0.1%)
0.024 Lacs (0.3%)
0.6 Lacs (8.3%)
Kota
7.8 Lacs
0.07 Lacs (0.9%)
4.3 Lacs (54.8%)
1.5 Lacs (18.7%)
0.4 Lacs (4.8%)
0.6 Lacs (8.0%)
0.003 Lacs (0.03%)
0.036 Lacs (0.4%)
0.6 Lacs (7.2%)
Nagaur
5.4 Lacs
0.15 Lacs (2.7%)
3.3 Lacs (60.3%)
1.0 Lacs (19.0%)
0.5 Lacs (8.7%)
0.3 Lacs (5.4%)
0.003 Lacs (0.06%)
0.008 Lacs (0.1%)
0.2 Lacs (3.7%)
Sawai Madhopur
5.6 Lacs
0.11 Lacs (2.0%)
3.1 Lacs (54.7%)
1.3 Lacs (22.3%)
0.5 Lacs (9.2%)
0.4 Lacs (6.8%)
0.006 Lacs (0.1%)
0.017 Lacs (0.3%)
0.3 Lacs (4.7%)
Sikar
6.1 Lacs
0.16 Lacs (2.6%)
3.6 Lacs (58.6%)
1.2 Lacs (19.5%)
0.5 Lacs (8.7%)
0.4 Lacs (5.9%)
0.005 Lacs (0.08%)
0.005 Lacs (0.09%)
0.3 Lacs (4.2%)
Tonk
2.6 Lacs
0.06 Lacs (2.3%)
1.5 Lacs (58.3%)
0.5 Lacs (19.8%)
0.2 Lacs (8.2%)
0.2 Lacs (6.5%)
0.008 Lacs (0.3%)
0.005 Lacs (0.1%)
0.1 Lacs (5.0%)
9. MEDIUM OF INSTRUCTION
Hindi is generally the medium of instruction. Orders have been issued for imparting instruction through minority languages, provided a minimum of 10 students in a class or 40 in a school so desire. Urdu, Sindhi, Panjabi and Gujarati are the actually recognized media of instruction at the Primary stage of education.
Primary
Upper Primary
Secondary
Higher
NCERT Third Survey
3
2
3
3
NCERT Fifth Survey
5
3
2
2
The State Government has adopted the simplified three-language formula, which entails the study of languages as under.
- Hindi, Urdu, Sindhi, Panjabi, or Gujarati as the first language.
- English as the second language.
- Malayalam as the third language.
HOME PAGE | BACK ISSUES | Preparing a Dictionary of Idioms in Indian Languages | Gown and Saree, Hand in Hand - A Review of Two English Readers for Indian Students | The Argument Structure of 'Dative Subject' Verbs | Linguistics Information in the Internet, With Special Reference to India | Urdu in Rajasthan | Sangeetha's Cookbook - Langue and Parole of Recipes - CHICKEN WITH HONEY LEMON SAUCE | CONTACT EDITOR
A. R. Fatihi, Ph.D.
Visiting Senior Faculty
Cornell University
E-mail: arf26@cornell.edu